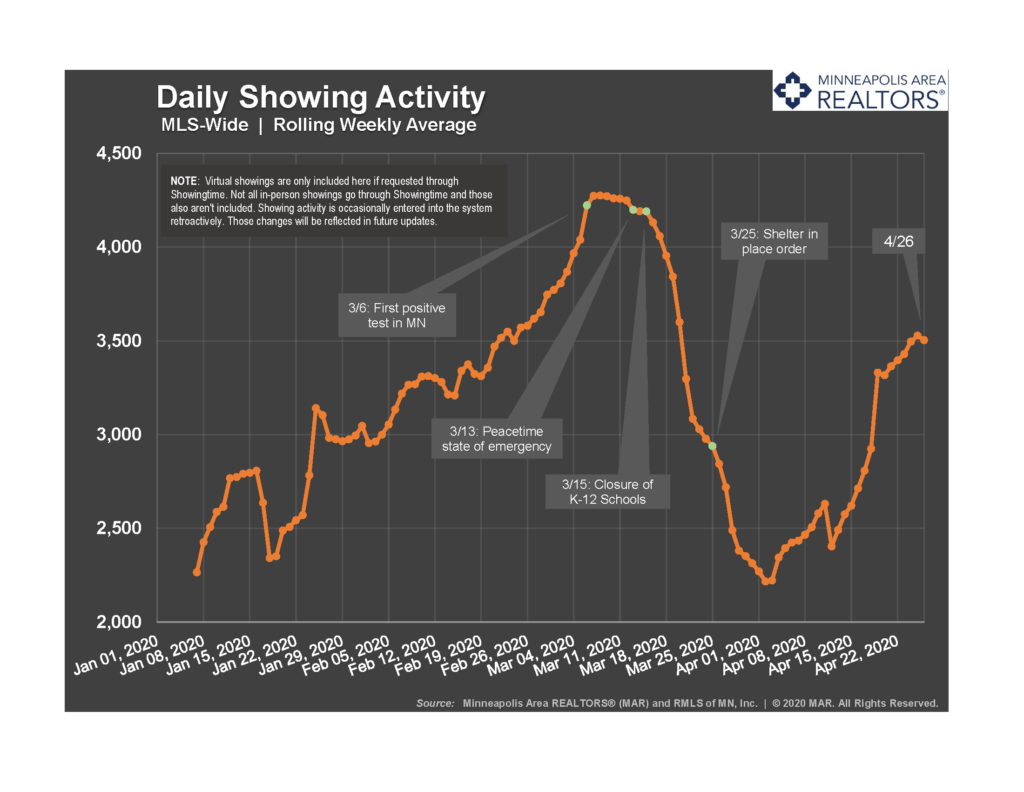
We begin with showing activity, which is one of the most reliable leading indicators of demand (mortgage applications are another good one). Since “bottoming” around the first week of April, showing activity has increased sharply since. In that first week of April, showings declined 46.5 percent from their March highs. Presently, showings are now just 18.0 percent below their March highs.
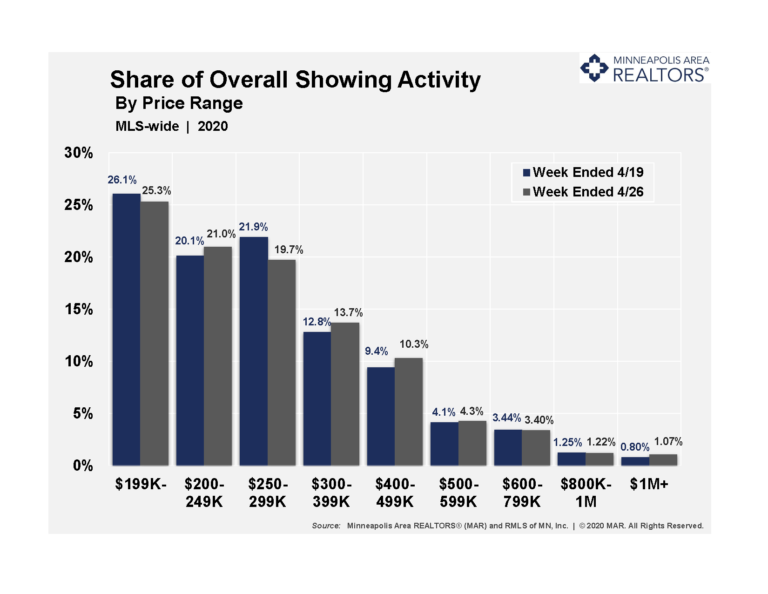
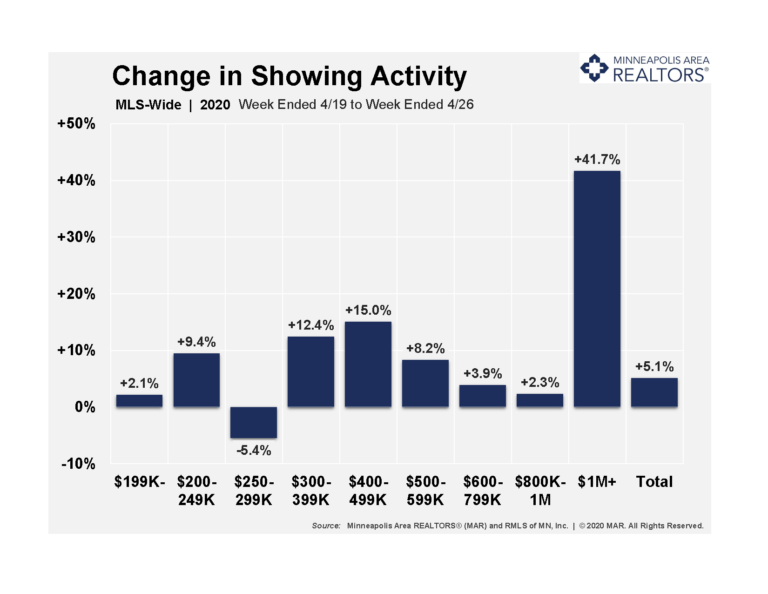
Despite an overall increase in showing activity lately, the gains aren’t shared evenly across all areas or price points. In fact the under-$200K and $250-$299K segments commanded a smaller share of showings in the most recent week versus the week prior. The same goes for homes between $600K and $1M. Homes priced over $1M accounted for 1.07 percent of showing activity compared to 0.8 percent during the previous week.
Looking now at change in showing activity by price range, the big winner was evidently luxury homes above $1M. Those listings tended to see a significant pullback in showing activity early on, so we’re comparing against a fairly low baseline. And this is also a “thin” market with limited activity, so even 10 or 20 additional showings can cause a significant increase here. Outside of the luxury market, we’re also still seeing some of the larger gains in those mid-market move-up ranges. With a 15.0 percent jump, the $400-499K segment witnessed the second largest gain in showings from week to week. The $300-400K range also enjoyed a 12.4 percent increase.
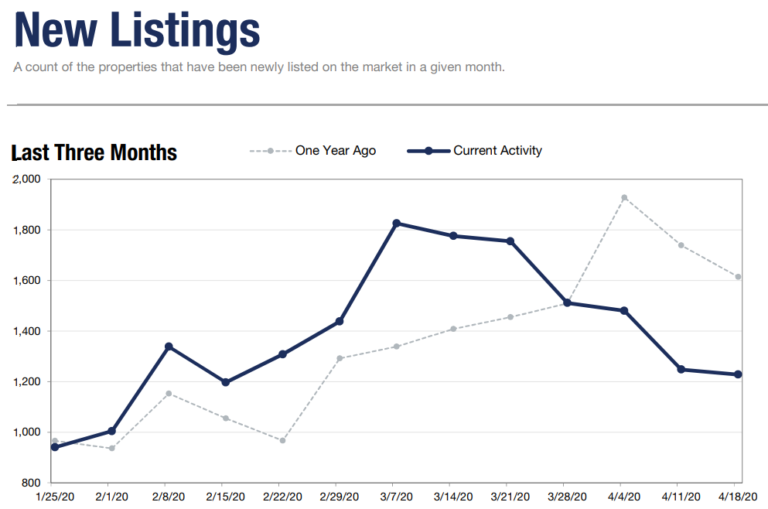
Next up is new listings and pending sales straight from our Weekly Market Activity Report. Both metrics are plotted through the week ended 4/18. While it’s too early to be sure, it appears as though the decline in seller activity that began in March could be leveling out and stabilizing. Then again, we saw a similar “head fake” moving into the week ended 4/4, so we’ll have to wait and see. New listing volume is on-par with mid-February levels. This is a time when we’d ordinarily expect new listings to rise (at least on a monthly basis, not always week to week).
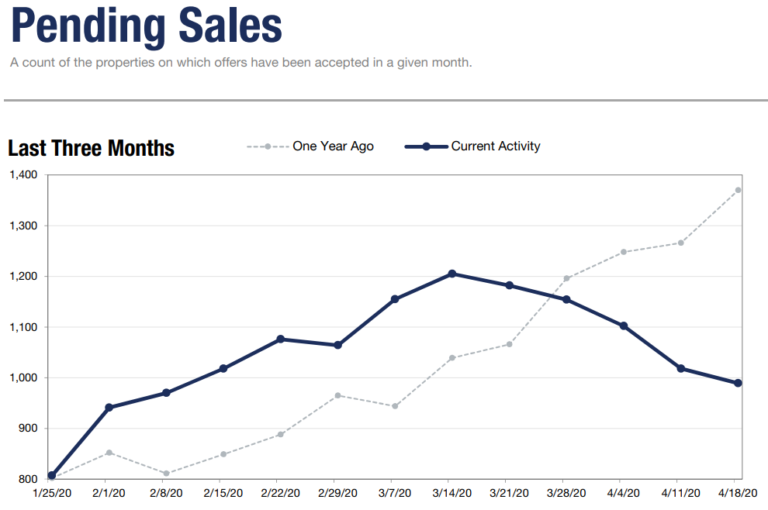
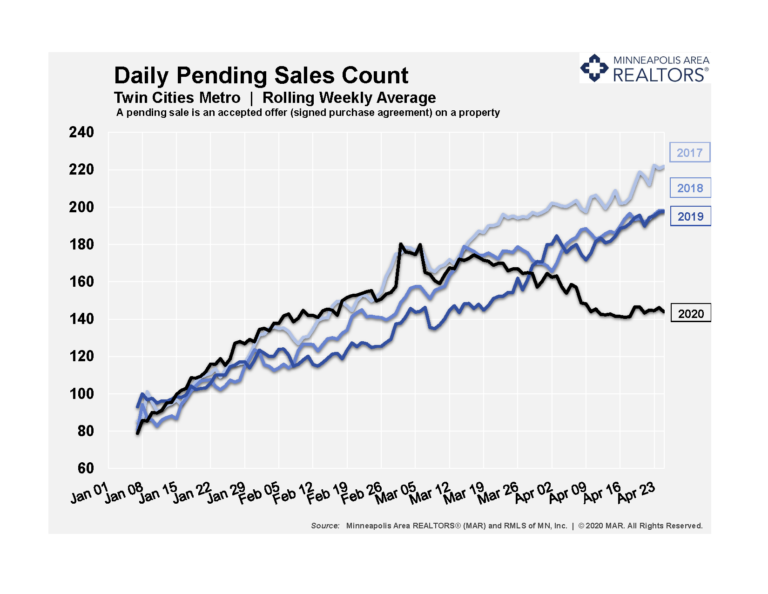
Similarly, it appears as though the declines in pending sales could be leveling out as well. The week ended 4/11 could be an inflection point. An inflection point is where the rate of growth or decline changes; this typically signals a trend change or at least an acceleration or deceleration in the rate of change. Pending sales are also back to mid-February levels. The increase in showings could foreshadow a recovery in pending purchase activity. And perhaps we’re seeing the early phases of that in our pending sales trend. This all still depends on the impact of the stimulus, the length of the outbreak and the consumer response.
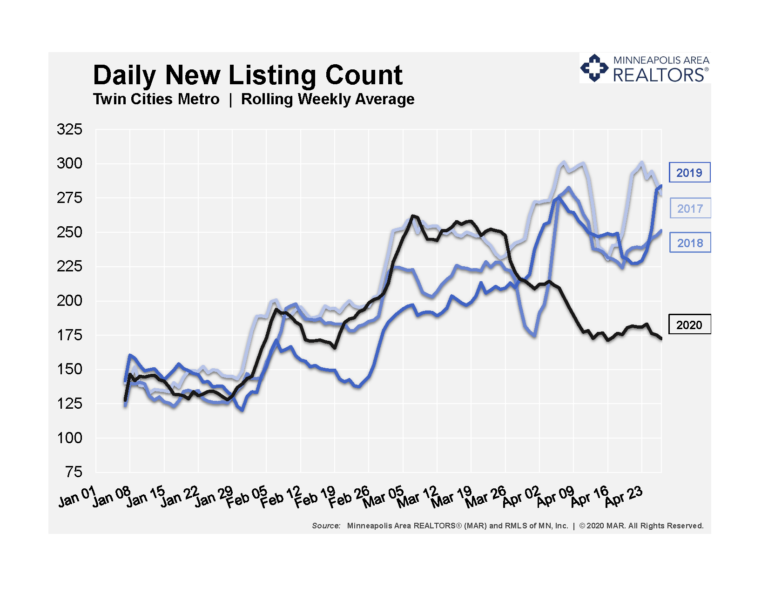
In this current fast-paced and ever-changing environment, our rolling weekly average of daily new listings can reveal more than the weekly report. Here we can more clearly see the trend of new listings stabilizing. We’ve found some “support” around the 175 level. Seller activity bounced up a hair and then settled back toward that 175 mark. Here we’re also able to confirm that seller activity is roughly back to mid-February levels.
This rolling weekly pending sales chart also enables us to see changes happen sooner than in the weekly report. The stabilization trend in pending sales looks more convincing than the potential bottoming trend in new listings. If you turn your head and squint, you can almost see the early phases of a potential turnaround in signed purchase agreements. This again depends on several factors outlined above. Also note that the stabilization in pending sales comes almost exactly two weeks after the turnaround in showing activity
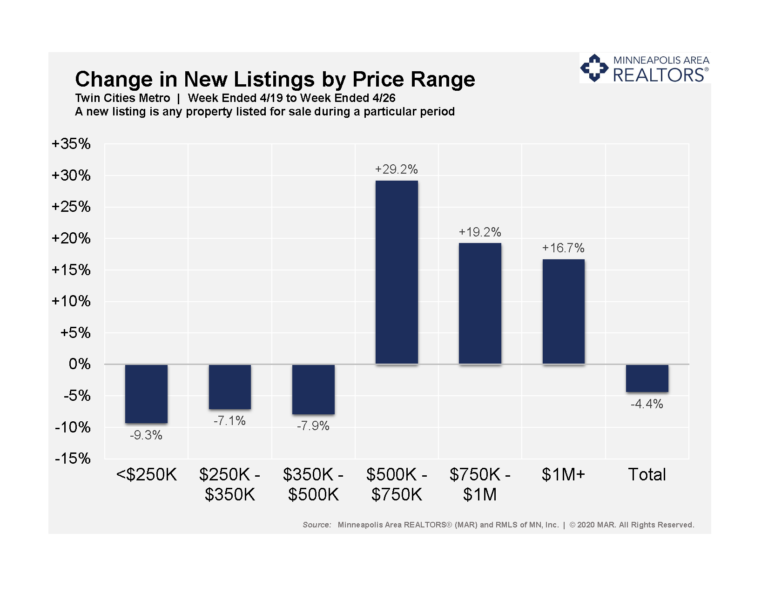
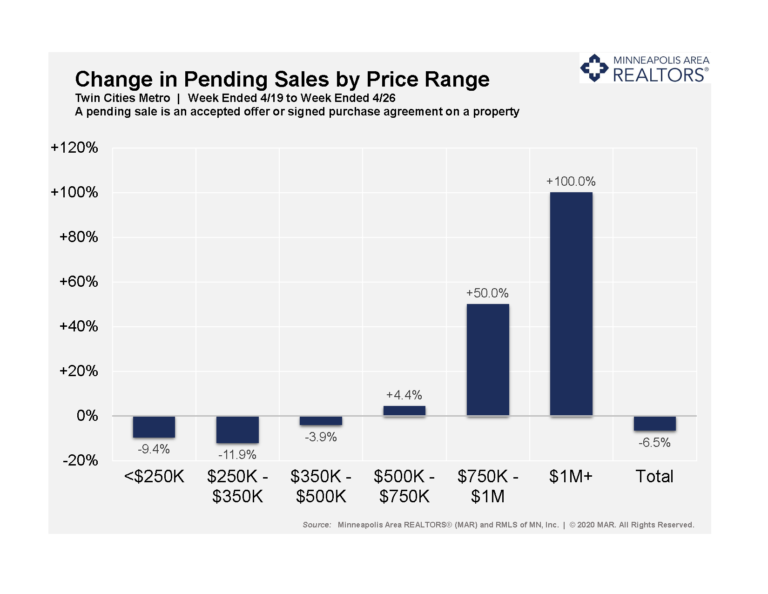
Below we showcase the change in weekly new listing and pending sales activity by price point. This lets us monitor week-to-week change in buyer and seller activity by price range. Some of the movement in various price ranges might surprise you. But as outlined above, some of the higher price points saw sharp pullbacks early on and even a few additional listings can sway those sub-markets with limited activity. Most of the activity between $500-750K occurs in the $500-600K range. That could be a second or third move-up home. Importantly, the change in pending sales mostly mirrors the change in new listings. This isn’t necessarily the case for the monthly numbers. On a monthly basis, luxury homes saw a significant gain in seller activity which was met with a reduction in buyer activity. Also note the declines in the more affordable segments aren’t as severe as they have been.
